![]()
Documentation 📑 Hands-on Tutorials 🎯 RisingWave Cloud 🚀 Get Instant Help


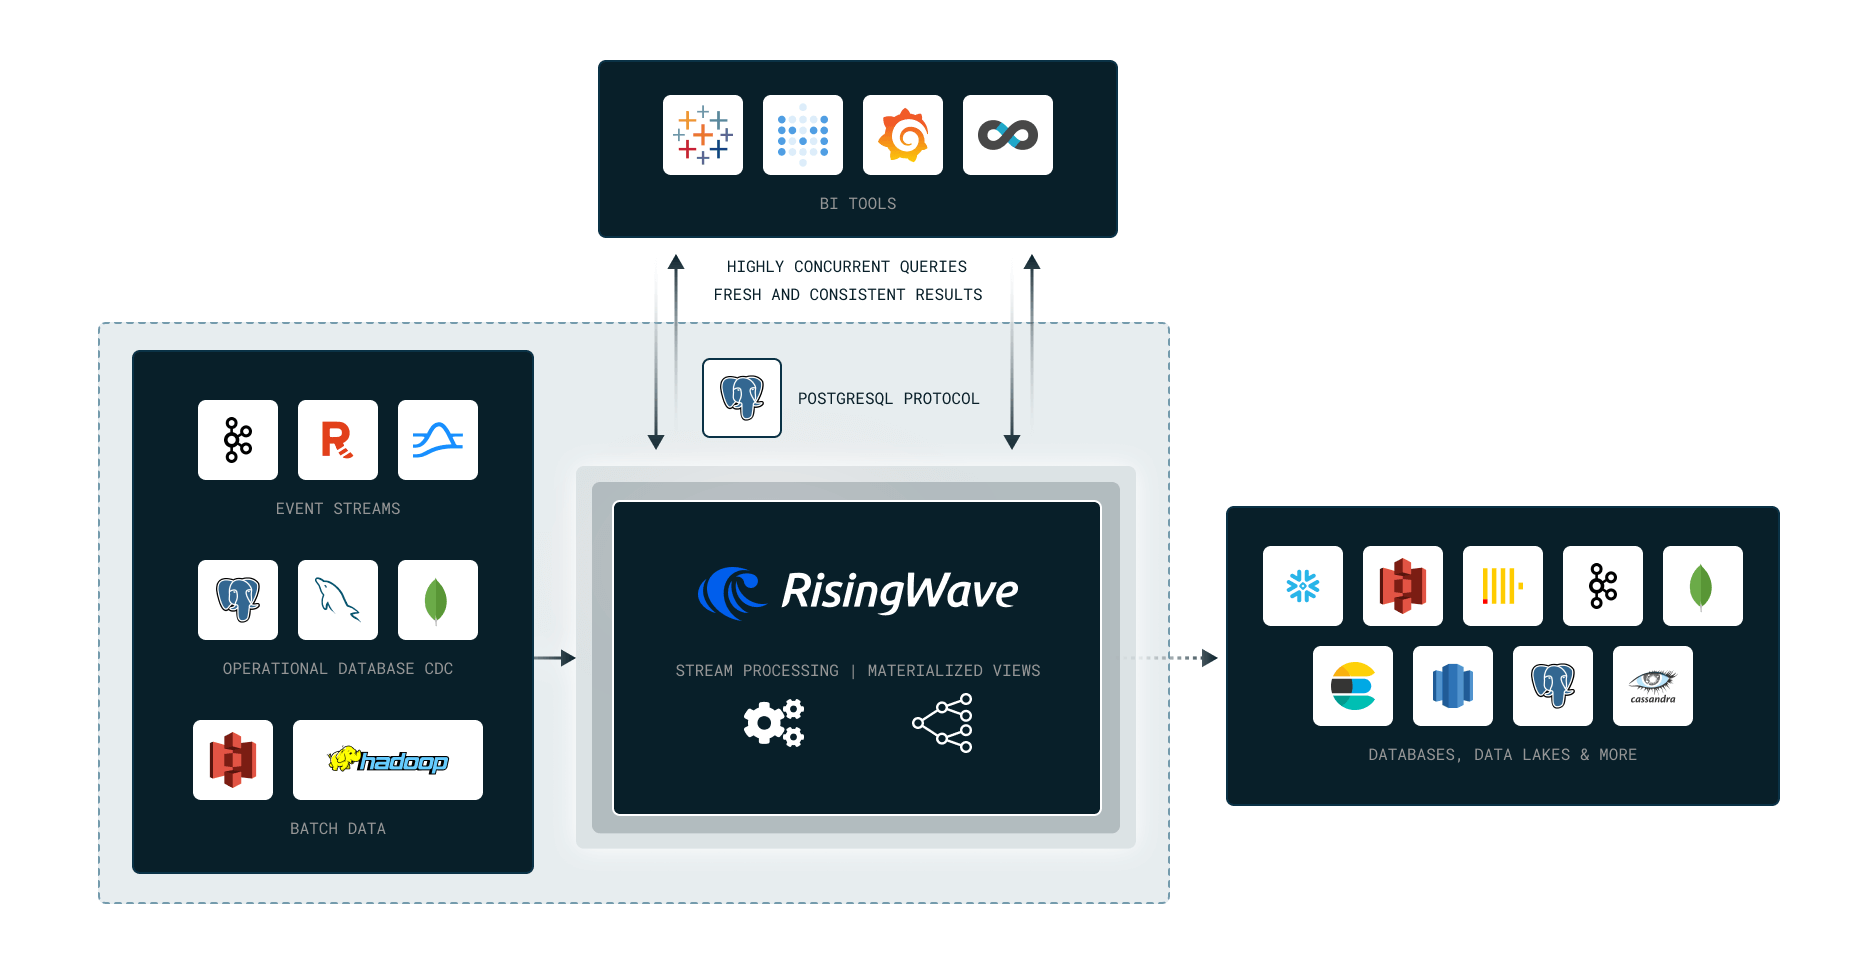
In this hands-on workshop, we’ll learn how to process real-time streaming data using SQL in RisingWave. The system we’ll use is RisingWave, an open-source SQL database for processing and managing streaming data. You may not feel unfamiliar with RisingWave’s user experience, as it’s fully wire compatible with PostgreSQL.
We’ll cover the following topics in this Workshop:
- Why Stream Processing?
- Stateless computation (Filters, Projections)
- Stateful Computation (Aggregations, Joins)
- Data Ingestion and Delivery
RisingWave in 10 Minutes: https://tutorials.risingwave.com/docs/intro
Workshop video:
Please setup the environment in Getting Started and for the Homework first.
This question is just a warm-up to introduce dynamic filter, please attempt it before viewing its solution.
What are the dropoff taxi zones at the latest dropoff times?
For this part, we will use the dynamic filter pattern.
Solution
CREATE MATERIALIZED VIEW latest_dropoff_time AS
    WITH t AS (
        SELECT MAX(tpep_dropoff_datetime) AS latest_dropoff_time
        FROM trip_data
    )
    SELECT taxi_zone.Zone as taxi_zone, latest_dropoff_time
    FROM t,
            trip_data
    JOIN taxi_zone
        ON trip_data.DOLocationID = taxi_zone.location_id
    WHERE trip_data.tpep_dropoff_datetime = t.latest_dropoff_time;

--    taxi_zone    | latest_dropoff_time
-- ----------------+---------------------
--  Midtown Center | 2022-01-03 17:24:54
-- (1 row)Create a materialized view to compute the average, min and max trip time between each taxi zone.
Note that we consider the do not consider a->b and b->a as the same trip pair.
So as an example, you would consider the following trip pairs as different pairs:
Yorkville East -> Steinway
Steinway -> Yorkville East
From this MV, find the pair of taxi zones with the highest average trip time. You may need to use the dynamic filter pattern for this.
Bonus (no marks): Create an MV which can identify anomalies in the data. For example, if the average trip time between two zones is 1 minute, but the max trip time is 10 minutes and 20 minutes respectively.
Options:
- Yorkville East, Steinway
- Murray Hill, Midwood
- East Flatbush/Farragut, East Harlem North
- Midtown Center, University Heights/Morris Heights
p.s. The trip time between taxi zones does not take symmetricity into account, i.e. A -> B and B -> A are considered different trips. This applies to subsequent questions as well.
Recreate the MV(s) in question 1, to also find the number of trips for the pair of taxi zones with the highest average trip time.
Options:
- 5
- 3
- 10
- 1
From the latest pickup time to 17 hours before, what are the top 3 busiest zones in terms of number of pickups? For example if the latest pickup time is 2020-01-01 17:00:00, then the query should return the top 3 busiest zones from 2020-01-01 00:00:00 to 2020-01-01 17:00:00.
HINT: You can use dynamic filter pattern to create a filter condition based on the latest pickup time.
NOTE: For this question 17 hours was picked to ensure we have enough data to work with.
Options:
- Clinton East, Upper East Side North, Penn Station
- LaGuardia Airport, Lincoln Square East, JFK Airport
- Midtown Center, Upper East Side South, Upper East Side North
- LaGuardia Airport, Midtown Center, Upper East Side North
- Form for submitting: https://courses.datatalks.club/de-zoomcamp-2024/homework/workshop2
- Deadline: 11 March (Monday), 23:00 CET
Everyone who completes the homework will get a pen and a sticker, and 5 lucky winners will receive a Tshirt and other secret surprises! We encourage you to share your achievements with this workshop on your socials and look forward to your submissions 😁
- Follow us on LinkedIn: https://www.linkedin.com/company/risingwave
- Follow us on GitHub: https://github.com/risingwavelabs/risingwave
- Join us on Slack: https://risingwave-labs.com/slack
See you around!