This is an example application that showcases how Watermill may be monitored with Prometheus metrics.
The docker-compose bundle contains the following services:
A Golang image which runs the example code. t consists of a router with a single handler.
The handler consumes messages from a Gochannel PubSub, and publishes 0-4 copies of the message with a preconfigured random delay.
Additionally, there is one goroutine which produces messages incoming to the handler with a gochannel publisher, and another goroutine which consumes the messages outgoing from the handler.
The router, the standalone publisher and the standalone subscriber are all decorated with the metrics code and their statistics will appear in the dashboard.
Prometheus, to scrape the metrics which the golang application exposes at :8081/metrics by default. It is configured by a prometheus.yml file, which declares the endpoints that Prometheus will scrape.
Grafana, to visualize the metrics in a dashboard.
To run the docker-compose bundle, go to _examples/metrics and execute:
docker-compose up
The golang app will start running, producing messages, passing them through the handler, and consuming the copies.
With default settings, the raw Prometheus metrics should appear at your http://localhost:8081/metrics.
The Prometheus image should expose a more advanced UI at http://localhost:9090/graph, where you can investigate all the scraped metrics.
However, what is the most useful way to monitor is through the use of Grafana, which you can access at http://localhost:3000.
The fresh Grafana image should greet you with a login screen:

Just use the default admin:admin credentials. You can skip changing the password, if you wish.
The next thing that we need to do is to add the Prometheus data source. Click on Add data source.
In the following screen:
- Enter a name for the Prometheus data source. Let's name this data source
prometheus. - Choose
Prometheusfrom theTypedropdown. - Enter the
http://localhost:9090value in the HTTP/URL section. - You can leave the remaining settings at default and click
Save & Test.
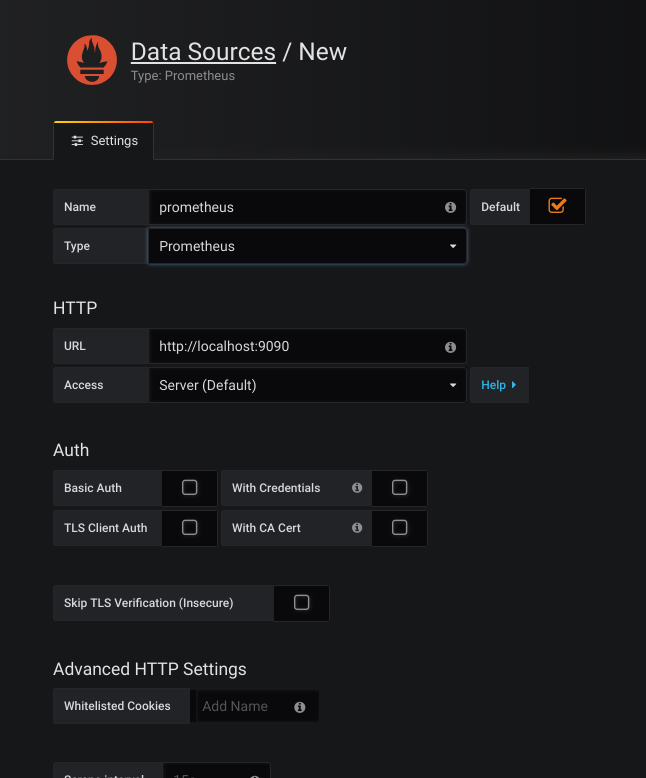
The Prometheus data source is now ready to use in Grafana.
We have prepared a Grafana dashboard that visualizes the metrics exported by this example.
To import the Grafana dashboard, select Dashboard/Manage from the left menu, and then click on +Import (or go to http://localhost:3000/dashboard/import).
Enter the dashboard URL https://grafana.com/dashboards/9777 (or just the ID, 9777), and click on Load.
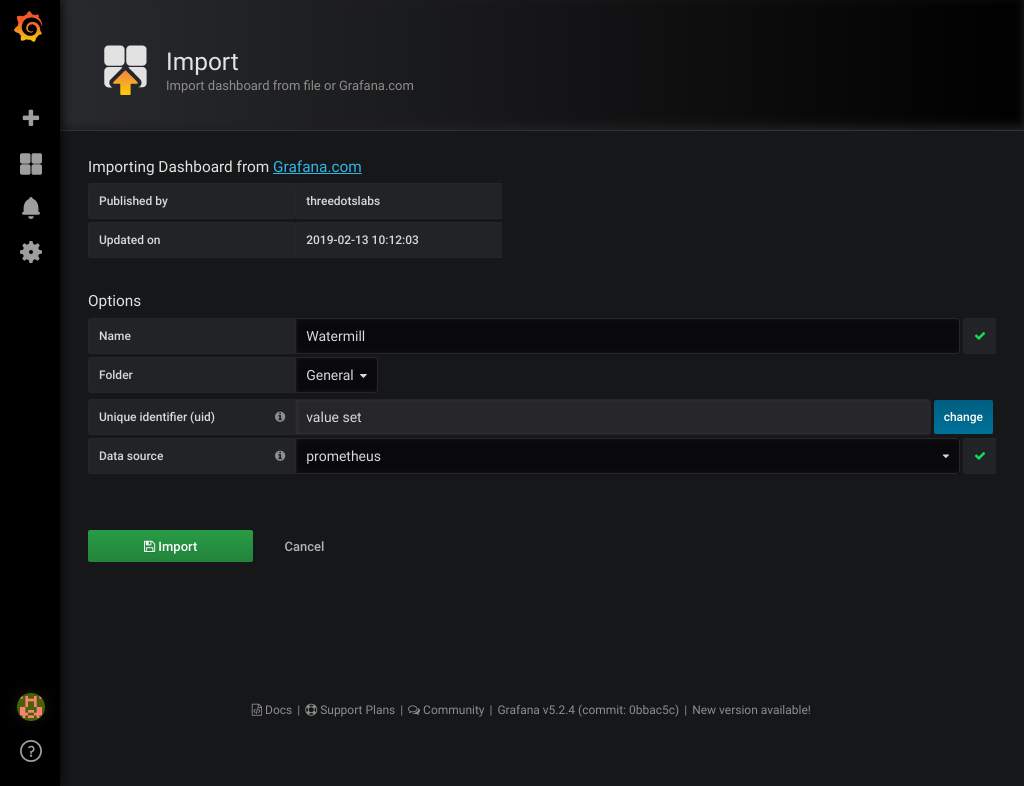
Then select the Prometheus data source created in the previous step. Click on Import, and you're done!
To find out more, about metrics be sure to check out the Watermill docs.