Thanks for your interest in contributing to Plotly.js! We are actively looking for diverse contributors, with diverse background and skills.
This document outlines the general way that changes get made to this library and by whom, and then provides specific technical information about how to set up a development environment for doing development and running tests.
Please check out our Code of Conduct. Don't tl:dr; it but the general idea is to be nice.
Plotly.js is a standalone Javascript data visualization library, and it also powers the Python and R modules named plotly in those respective ecosystems (referred to as Plotly.py and Plotly.R, respectively, for clarity). There also exist Plotly.js-powered libraries for other languages such as Julia, Scala, Rust, .NET and even C++!
The basic architecture of Plotly.js is to accept JSON representation of figures that adhere to the figure schema and draw interactive graphical representations of these figures in a browser. Libraries in other languages like Python and R provide idiomatic interfaces for users of those languages to create and manipulate these JSON structures, and arrange for them to be rendered in a browser context by Plotly.js. This means that in many cases, when a Python or R user wishes to add a feature to the library they know as plotly, the relevant changes must be implemented in Plotly.js, in this repo.
A new feature is composed of additions to the schema - adding new attributes, adding entire new trace types, or just adding new values to existing attributes - along with the associated drawing code. This project has a strong commitment to backwards-compatibility, so changing the graphical output for existing schema attributes and values, or changing the default value of an attribute, is generally only done as a mostly-backwards-compatible bug fix, for cases when the current graphical output is incorrect, nonsensical or otherwise very problematic. Non-schema-related features and bug fixes are possible as well, usually around performance, security, bundling, function signatures etc, and generally follow the same principles.
The basic process for adding new features or fixing bugs is as follows. Please note that this is a bit of an idealized outline and that things often don't proceed in a clean/linear fashion and that's ok :)
- Discussion - A community member or maintainer creates an issue to discuss the use-case for the new feature. This usually entails describing the desired graphical output and discussing how close the current system can get to specifying or drawing such a figure. If the issue is perceived to be a bug, the discussion revolves around understanding how the current behaviour is incorrect or problematic, and how existing users of the system would be impacted by a change in this behaviour.
- Proposal - If the current system cannot specify or draw such a figure, or if the way to do it is too onerous, a good next step would be to discuss or propose a specific change to the schema: new attributes to be added or new accepted values to new attributes, along with a prose description of the proposed drawing code. If the issue is determined to be a bug rather than a feature, the same type of proposal is required: a definition of which attributes and values will be impacted by the proposed change. A good proposal includes discussion of whether or not existing attributes can be modified rather than adding new attributes and details about which trace types or subplot types are impacted by the change. Note: sometimes community contributors skip this step and go straight to development & review (below), but going through a proposal can help speed along the review process!
- Iteration - The maintainers of the library or any other interested community member will then give feedback on the proposal, usually focused on consistency with the rest of the schema, and helping define a test plan to further elaborate potential edge cases.
- Approval - After a number of iterations, the maintainers of the library will generally approve a proposal with an informal "this seems like something we would accept a pull request for" comment in the issue.
- Development - A community member or maintainer creates a branch and makes the appropriate modifications to the code and tests and opens a pull request. This can be more or less time-consuming and challenging, depending on the nature of the change.
- Review - The maintainers of the library will review the pull request, working with the original authors to ensure the code is ready for merging. This can involve quite a few iterations and exploration of edge cases, additions of tests etc, but the maintainers are very happy to have outside contributors and will try to make this as painless as possible. Starting out with a previously-discussed proposal (see above) generally helps make this smoother as it reduces the likelihood of overlooked requirements that would prevent a merge.
- Long-term Maintenance - Once the code is merged, the maintainers of the library will generally look after its maintenance, performance, security, bug fixes etc, although the original author of a feature is always welcome and encouraged to participate in this process!
The current Plotly.js maintainers are all employees of Plotly (the company) and one of their primary responsibilities is ensuring the process above runs smoothly. It is worth noting that maintainers and non-maintainer Plotly employees all follow the process above: proposing changes, iterating on proposals and eventually developing and reviewing each other's pull requests. As mentioned above, maintainers look after bug fixes, performance, security, documentation and concerns that impact the long-term prospects for this library. In terms of development work, maintainers tend to prioritize issues that do or are likely to impact Plotly customers, as well as on sponsored features or bug fixes. Sponsored work proceeds via the process listed above, albeit with the option of conducting portions of the "discussion" step in a confidential setting if desired. Please note that maintainers are happy and eager to help with community-led pull requests, independent of customer-driven development priorities :)
The Plotly.js community, construed fairly broadly, includes the maintainers and all users of Plotly.js and associated projects (Plotly.py, Dash, Plotly.R, Chart Studio and many others). The community includes people from any background, domain, affiliation and level of technical expertise, for example (but not limited to!) employees of small or large companies or startups; employees or students of universities or other educational institutions; government employees and contractors; employees and volunteers of non-profits; individual hobbyists etc.
Anyone in the community is encouraged to contribute to every step of the process described above! Creating issues to report bugs or suggest new behaviours is a valuable contribution to this project, as is proposing a concrete set of changes to address issues created by anyone at any time. In the same way, giving feedback on proposals created by anyone in the community is valuable, as is, of course, development and review work. Proposing changes to the documentation of Plotly.js or associated projects is an extremely valuable form of contribution, as is asking or answering questions on our community forum, as it creates a record of a question and discussion, which others can stumble across later and use to further their own work.
Please read the issue guidelines.
Please read the pull request guidelines.
We use the following labels to track issues and PRs:
| Label | Purpose |
|---|---|
type: bug |
bug report confirmed by a plotly team member |
type: regression |
bug that introduced a change in behavior from one version to the next |
type: feature |
planned feature additions |
type: new trace type |
subset of type: feature reserved for planned new trace types |
type: translation |
localization-related tasks |
type: performance |
performance related tasks |
type: maintenance |
source code cleanup resulting in no enhancement for users |
type: documentation |
API doc or attribute description improvements |
type: community |
issue left open for community input and pull requests |
type: duplicate |
self-explanatory |
type: wontfix |
self-explanatory |
status: discussion needed |
Issue or PR that required discussion among maintainers before moving forward |
status: in progress |
PRs that required some initial feedback but not ready to merge |
status: reviewable |
PRs that are completed from the author's perspective |
status: on hold |
PRs that are put on hold |
- git
- node.js. We recommend using node.js v16.x.
Upgrading and managing node versions can be easily done using
nvmor its Windows alternatives. npmv7.x and up to ensure that thepackage-lock.jsonfile is used and updated correctly.
git clone --depth 1 git@github.com:<your-GitHub-username>/plotly.js.git
cd plotly.js# please do not use master or main for your dev branch
git checkout dev-branch-namenpm installnpm run pretestnpm startThis command bundles up the source files and opens up a tab in your browser.
A typical workflow is to make some modifications to the source, update the
test dashboard, inspect and debug the changes, then repeat. The test dashboard
comes bundled with some useful tools while developing - all bundled under the
Tabs object:
| Method/Property | Description |
|---|---|
Tabs.fresh([id]) |
Creates a fresh graph div and returns it (default id of graph). |
Tabs.getGraph([id]) |
Returns the default or specified graph div. |
Tabs.plotMock(mock, [id]) |
Plots the specified mock (.json extension is not required). |
Tabs.snapshot([id]) |
Creates a png snapshot of the plot and places it below. |
Tabs.reload() |
Reloads the plotly.js script and will execute Tabs.onReload once completed. |
Tabs.onReload() |
By default, set to noop but you may set Tabs.onReload to any function you wish. This is useful for replotting a mock or test every time you reload the plotly.js script. |
Tabs.purge() |
Destroys all plots. |
View the source for more info.
Three additional helpers exist that are refreshed every second:
gd- this is the default plot divfullData- shortcut togd._fullDatafullLayout- shortcut togd._fullLayout
There is also a search bar in the top right of the dashboard. This fuzzy-searches image mocks based on their file name and trace type.
npm run schemaIf you are editing attribute descriptions or implementing a new feature this file located in the test folder records the proposed changes to the API. Note that there is another plot-schema.json file located in the dist folder, which should only be updated by the maintainers at release time.
IMPORTANT: please do not change and commit any files in the "dist" folder
If you are implementing a new feature that involves regl shaders, or if you are making changes that affect the usage of regl shaders, you would need to run
npm run regl-codegento regenerate the regl code. This opens a browser window, runs through all traces with 'regl' in the tags, and stores the captured code into src/generated/regl-codegen. If no updates are necessary, it would be a no-op, but if there are changes, you would need to commit them.
This is needed because regl performs codegen in runtime which breaks CSP compliance, and so for strict builds we pre-generate regl shader code here.
npm run preprocess: pre-processes the css and svg source file in js. This script must be run manually when updating the css and svg source files.npm run watch: starts a watchify file watcher just like the test dashboard but without booting up a server.
Both jasmine and image tests are run on CircleCI on every push to this repo.
Jasmine tests are run in a browser using karma. To run them locally:
npm run test-jasmine
To run a specific suite, use:
npm run test-jasmine -- <suite>
where the <suite> corresponds to the suite's file name as found in
test/jasmine/tests/.
You can also test multiple suites at a time, for example:
npm run test-jasmine -- bar axes scatter
which will run tests in the bar_test.js, axes_test.js and scatter_test.js
suites.
To turn off the autoWatch / auto-bundle / multiple run mode:
npm run test-jasmine -- <suite> --nowatch
In certain situations, you may find that the default reporting is not verbose enough to pin down the source of the failing test. In this situation, you may wish to use karma-verbose-reporter:
npm run test-jasmine -- <suite> --verbose
For more info on the karma / jasmine CLI:
npm run test-jasmine -- --help
npm run test-jasmine -- --info
If you prefer using docker each time you need to
docker run -it -v "$(pwd)":/plotly.js circleci/python:3.8.9 bash
# then inside the docker
cd plotly.js
sudo bash .circleci/env_image.shOtherwise you may need to install
python 3.8Then upgradepipif needed
python3 -m pip install --upgrade pipTo install required fonts and tools see this shell script.
python3 test/image/make_baseline.py = mock_1 mock_2Alternatively using npm & node.js (which are not available in the python docker by default)
npm run baseline mock_1 mock_2Or
npm run baseline mock_*IMPORTANT: the baseline, test-image and test-export scripts do not bundle the source files before
running the image tests. We recommend running npm run watch or npm start in
a separate tab to ensure that the most up-to-date code is used.
Also if you are adding a new mock, you may need to re-run npm start or npm run watch
to be able to find the new mock in the browser.
To help ensure valid attributes are used in your new mock(s), please run npm run test-mock
or npm run test-mock mock_name(s) after adding new mocks or implementing any new attributes.
If you added new mocks to test/image/mocks folder, to generate draft baselines run
python3 test/image/make_baseline.py = mockFilename1 mockFilename2Then commit the new baselines and push.
Please note that image pixel comparison tests run using circleci/python:3.8.9 docker container.
Therefore the final baselines may need updates.
This could simply be done by downloading the baselines.tar stored in the ARTIFACTS tab of test-baselines job (if the test failed).
- Click on the
DEBUGbutton - In the
DEBUG RUNNERwindow, open the console (e.g. with<ctrl-shift-j>) - Find test file (e.g. with
<ctrl-o>+ typing the name of the file), look out for "bundled" files with the same name. - Set
debuggeron relevant line(s) - Rerun the test suite by refreshing the page (e.g. with
<crtl-r>)

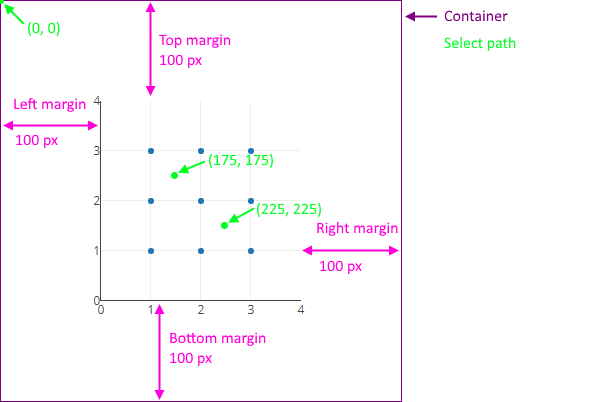
Keep in mind that the interaction coordinates are relative to the top-left corner of the plot, including the margins. To produce a reliable interaction test, it may be necessary to fix the width, height, margins, X axis range and Y axis range of the plot. For example:
Plotly.newPlot(gd, [{
    x: [1, 1, 1, 2, 2, 2, 3, 3, 3],
    y: [1, 2, 3, 1, 2, 3, 1, 2, 3],
    mode: 'markers'
}], {
    width: 400, height: 400,
    margin: {l: 100, r: 100, t: 100, b: 100},
    xaxis: {range: [0, 4]},
    yaxis: {range: [0, 4]}
});
This will produce the following plot, and say you want to simulate a selection path of (175, 175) to (225, 225):
- Distributed files are in
dist/ - CommonJS require-able modules are in
lib/ - Sources files are in
src/ - Build and repo management scripts are in
tasks/ - All tasks can be run using
npm run-script - Tests are
test/, they are partitioned intoimageandjasminetests - Test dashboard and image viewer code is in
devtools/ - Built files are in
build/(the files in here are git-ignored, except forplotcss.js)
The trace modules (found in src/traces)
are defined as plain objects with functions and constants attached to them in an index file
(e.g. src/traces/scatter/index.js). The trace modules are "registered" undo the Registry object
(found in src/registry.js) using
Plotly.register (as done in the index files in dist/).
The trace module methods are meant to be called as part of loops during subplot-specific
(e.g. in plots/cartesian/index.js) and figure-wide (e.g. in plots/plots.js) subroutines.
That way, the subroutines work no matter which trace modules got registered.
All traces modules set:
_module.name: name of the trace module as used by the tracetypeattribute._module.basePlotModule: base plot (or subplot) module corresponding to the trace type (e.g.scatterlinks to theCartesianbase plot module,scatter3dlinks togl3d)._module.attributes: JSON-serializable object of attribute declarations. This object is used to generate the plot-schema JSON._module.supplyDefaults: Takes in input trace settings and coerces them into "full" settings undergd._fullData. This one is called during the figure-widePlots.supplyDefaultsroutine. Note that thesupplyDefaultsmethod performance should scale with the number of attributes (not the number of data points - so it should not loop over any data arrays)._module.calc: Converts inputs data into "calculated" (or sanitized) data. This one is called during the figure-widePlots.doCalcdataroutine. Thecalcmethod is allowed to scale with the number of data points and is in general more costly thansupplyDefaults. Please note that some edit pathways skipPlots.doCalcdata(as determined by theeditTypeflags in the attributes files)._module.plot: Draws the trace on screen. This one is called by the definedbasePlotModule.
Other methods used by some trace modules:
_module.categories: list of string identifiers used to group traces by behavior. Traces that have a given category can then be detected usingRegistry.traceIs_module.layoutAttributes: JSON-serializable object of attribute declarations coerced in the layout (e.g.barmodeforbartraces)_module.supplyLayoutDefaults: Defaults logic for layout attributes._module.crossTraceDefaults: Defaults logic that depends on input setting of multiple traces._module.crossTraceCalc: Computations that depend on the data of multiple traces._module.colorbar: Defines the colorbar appearance for traces that support it._module.hoverPoints: Point-picking logic called during hover._module.selectPoints: Polygon-containing logic called during selections._module.style: Sometimes split from_module.plotwhere_module.plotonly draws the elements and_module.stylestyles them._module.styleOnSelect: Optimization of_module.stylecalled during selections._module.convert: Sometimes separated from_module.plotor_module.calcto convert the plotly.js settings to another framework e.g. togl-plot3dforgl3dtraces, tomapbox-glfrommapboxtraces. This split can make the logic easier to test. If you make aconvert, you should call it from eithercalcorplot.
Check if ok, with npm run lint
- See eslintrc and the eslint list of rules for more details.
- Rules listed in the eslintrc file with the ignore flag
0are the recommended rules for new code added.