How to create your first chart
Welcome to SwiftUI ChartViews. We are going to get started and creating our first chart. First of all create a new empty Xcode project which uses SwiftUI, and follow the installation guide to add ChartViews as a dependency.
The first step in our new and empty application is to open the view (usually called ContentView by default) and import SwiftUICharts on the top.
import SwiftUIChartsOnce you have imported SwiftUICharts, you can access all the classes and views it brings to the project.
You can create four type of charts for now. Bar chart, Line chart, Pie chart and Ring chart. But first we need some data to display.
Declare your data inside the View
struct ContentView: View {
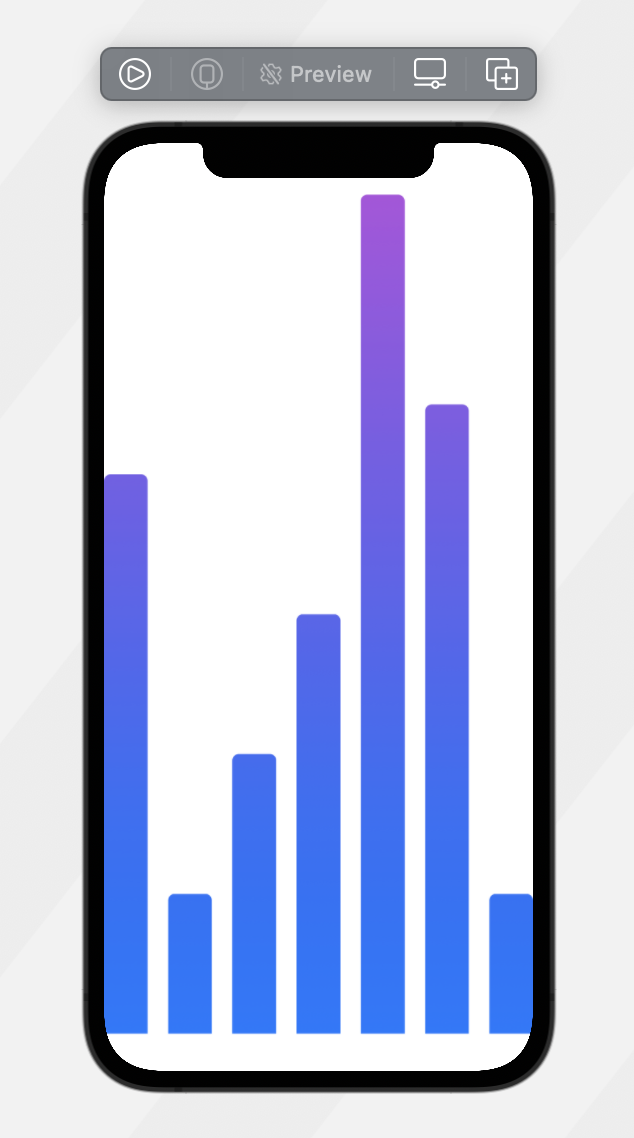
var demoData: [Double] = [8, 2, 4, 6, 12, 9, 2]
If your data might change while the view is displayed, you can declare the data as a @State variable, so the charts will update based on the changes.
To create the chart we need to add the type of the chart we are using inside the body
var body: some View {
    BarChart()
    ...
}
To attach our data to our chart we will use the .data(...) function which will take our data in the argument.
var body: some View {
        BarChart()
            .data(demoData)
}
Behind the scenes .data(...) function uses @EnvironmentObject to pass the data to the chart.
Once we attached the data only one last thing we need to do. Style our chart.
We use the .chartStyle(...) function to add our style. This takes a ChartStyle as an argument.
In a ChartStyle you can define the colour of the background and the colours of the foreground. You can use plain colours or Gradients. Gradient is a custom ColorGradient(_ startColor: Color, _ endColor: Color) class which needs a start and end Color in order to create the gradient.
var body: some View {
    BarChart()
        .data(demoData)
        .chartStyle(ChartStyle(backgroundColor: .white,
                               foregroundColor: ColorGradient(.blue, .purple)))
}
We are ready to view our first chart! 🎉
-
you can change the chart type by replacing
BarChart()withLineChart(),PieChart()orRingsChart() -
you can add another foreground color and see what's the effect in bar, pie or rings chart:
.chartStyle(ChartStyle(backgroundColor: .white,
                                   foregroundColor: [ColorGradient(.blue, .purple),
                                                     ColorGradient(.orange, .red)]))