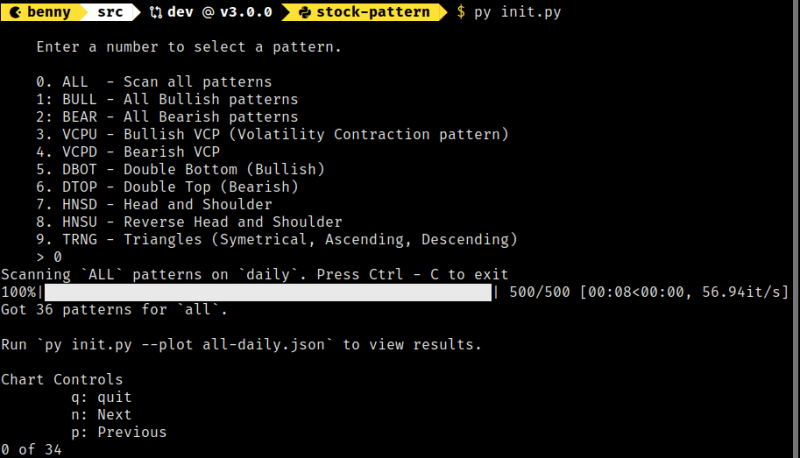
A Python CLI scanner to detect and plot common chart patterns
Supports Python >= 3.8 (As of v1.1.1-alpha)
If you ❤️ my work so far, please 🌟 this repo.
These were a series of pattern scanners I wrote for experimentation and fun in 2022. My inspiration was this Medium article Algorithmically Detecting (and Trading) Technical Chart Patterns with Python
Understand how the code works: wiki Pattern Algorithms
All patterns are detected, prior to breakout. at the last leg of the pattern. Add the stock to your watchlist and track them further.
This program does not provide any buy or sell signals. It only detects the pattern. It is upto you to decide, if a pattern is valid or tradeable.
Stock-Pattern is being constantly updated with new features and bug fixes. Run
git pullto get the latest updates.
- Clone or download the repo:
git clone https://github.com/BennyThadikaran/stock-pattern.git - Install dependencies:
pip install -r requirements.txt - Run
init.py. It will generate auser.jsonfile - Open
user.jsonand edit theDATA_PATHwith the folder path to your OHLC data.- Files must be in CSV format in any timeframe and filenames must be lowercase. For ex. infy.csv
- If using EOD2 point it to
src/eod2_data/daily
- Optionally, add a
SYM_LISTwith a file path (CSV or TXT file) containing a list of symbols to scan (One on each line).
# Assuming your files are named infy.csv etc.
infy
tcs
marksans
godrejind
- See wiki Configuration for more options
{
  "DATA_PATH": "~/Documents/python/eod2/src/eod2_data/daily",
  "SYM_LIST": "~/Desktop/nifty_500.csv",
  "POST_SCAN_PLOT": true
}
Note for Window users
- Add an extra backslash
\\for directory separators in JSON. This will avoid JSON decode errors. - Tilde
~works on both Windows and Linux and expands to user's folder
{
  "DATA_PATH": "~\\Documents\\python\\eod2\\src\\eod2_data\\daily",
  "SYM_LIST": "~\\Documents\\python\\stock-pattern\\src\\data.csv",
  "POST_SCAN_PLOT": true
}Moving to version 3.0.0? See Quick usage and config
For backtest.py usage, see wiki backtest
- The following columns are expected: Date, Open, High, Low, Close, Volume. Additonal columns may exist.
- Dates must be in Descending order (Oldest to Newest).
HUDCO - Double Bottom 16th June 2022
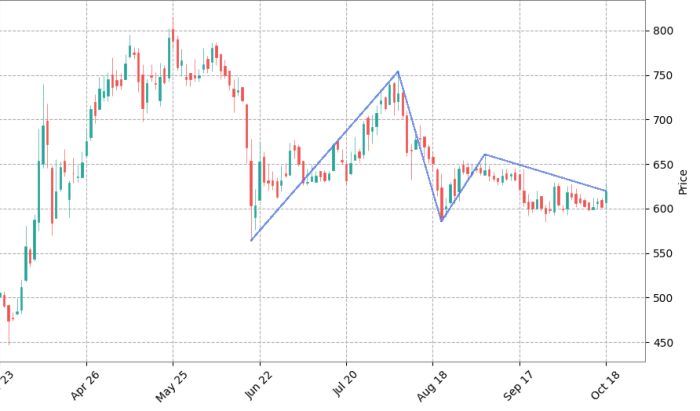
GRAPHITE - Bear VCP 18th Oct 2022
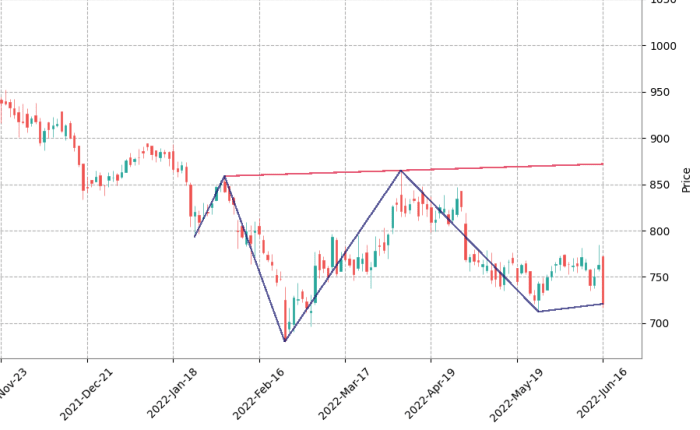
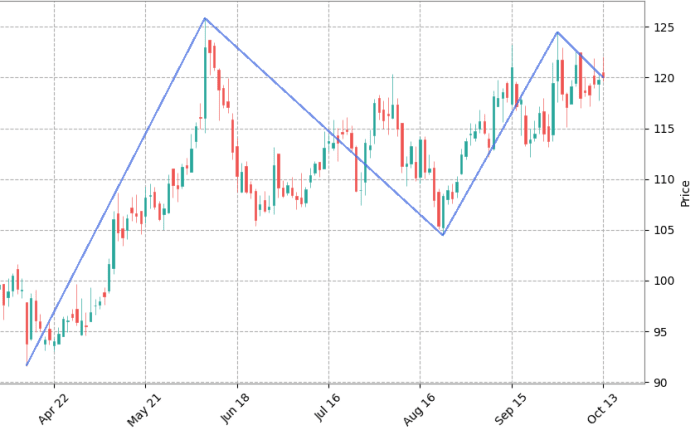
MGL - Reverse Head & Shoulder 16th June 2022
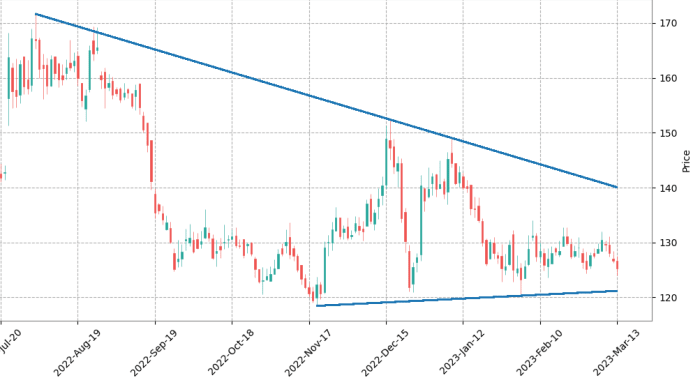
GSFC - Triangle 13th March 2023
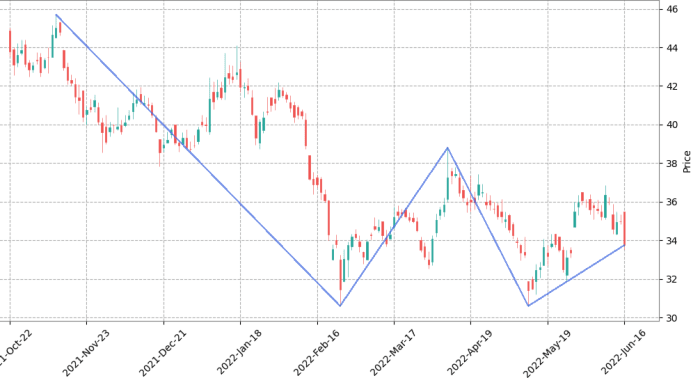
RECLTD - Double Tops 13th Oct 2021
This program identifies common chart patterns and does it reasonably well (IMHO).
Stock-Pattern is not aimed at replacing a trader's trained eye. It is merely an assistance and learning tool.
CLI options available, for you to backtest the patterns. If you intend to trade these patterns, study them well and trade at your own risk.