- My Studies of Urban GIS
- 1.The visualization of OLS in ArcGIS(for R)
- 2.AQI&Search Index in Beijing(for R)
- 3.Spatial visualization demo in folium (for Python)
- 4.How to draw a world map where china locate at the middle of map(for R)
- 5.Choose a better method of cartogram(for R)
- 6.The visualization of quantile plots and maps of China(for R)
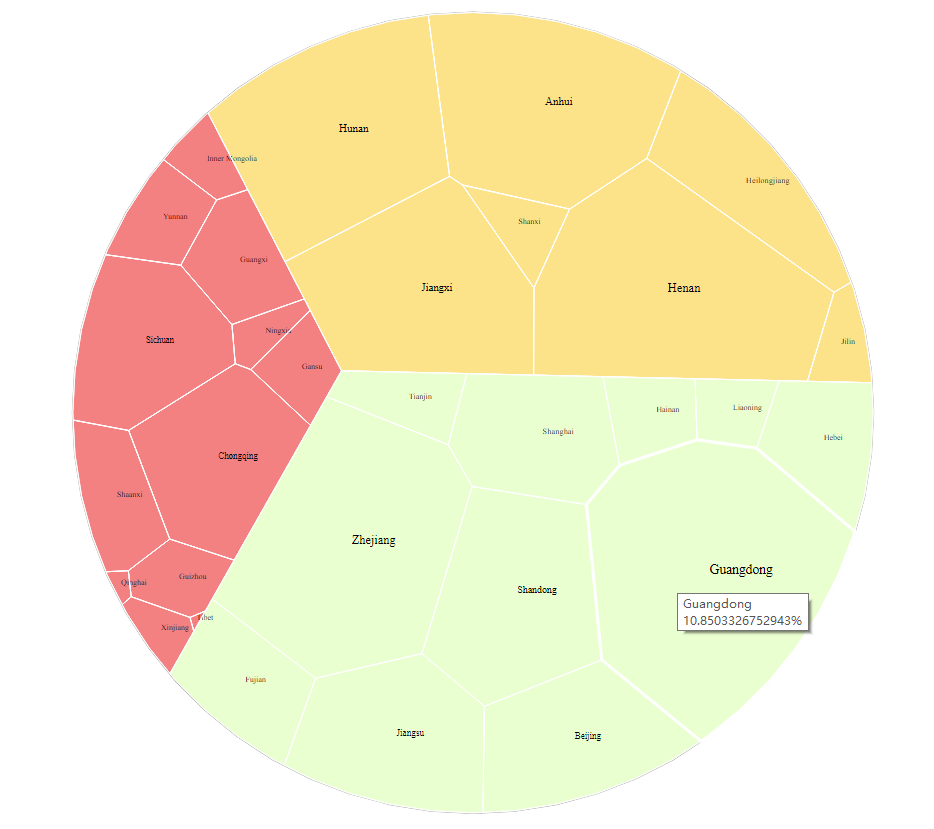
- 7.The visualization of voronoi treemap(for R)
- 8.Read the large NetCDF file using R
Created by gh-md-toc
| Author | Shaoqing Dai |
|---|---|
| dsq1993qingge@163.com |
Some code of my studies about Urban(based on R, Matlab, Python, CGA and so on).
details:
How to read spatial data in R and visual the result of OLS in ArcGIS(for R)

It's my classmate's homework with my help. The homework is about the relationship between AQI and "Baidu" Search Index in Beijing. In 2015, Prof.Liu, who comes from Peking University published a paper "Social Sensing: A New Approach to Understanding Our Socioeconomic Environments". The data in homework is typical data of social sensing. I think it's very interesting.
/output/plot.jpg)
Some spatial visualization demo in folium.
/output/windspeed.png)
details:
How to draw a world map where china locate at the middle of map
/Rproject/output/15855136767897p7w4zvv.png)
details:
/output/cartogram.gif)
The tutorial data can be downloaded from this link. If you used the data, please cited as follow:
Tan Minghong,Li Shiji,Sun Zhigang,Li Xiubin.Vegetation Cover Change on Rural-urban Migration in Inner Mongolia, China[DB/OL].Global Change Research Data Publishing & Repository,2016.DOI:10.3974/geodb.2016.06.05.V1.
details:
The visualization of quantile plots and maps of China(for R)

Python version from allenLu2008
details:
details:
