Easy open source monitoring for ML models.
A sidecar agent that creates metrics for monitoring deployed machine learning models.
![]()
MetricRule agents are designed to be deployed with a serving model endpoint to generate input feature and output distribution metrics based on the model's endpoint usage. Integrations with Tensorflow Serving and KFServing are supported.
The motivation of this project is to make it easier to monitor feature distributions in production to better catch real world ML issues like training-serving skew, feature drifts, poor model performance on specific slices of input.
The recommended usage with TFServing is to deploy the agent as a sidecar with the model.
The executable used is cmd/proxy. The latest release is available at Docker Hub.
The recommended usage with KFServing is to use the agent as a logger sink.
The executable used is cmd/eventlistener. The latest release is available at Docker Hub.
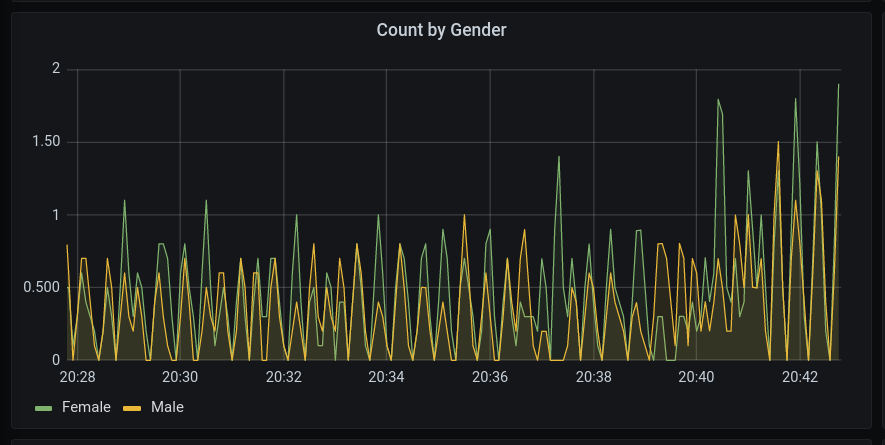
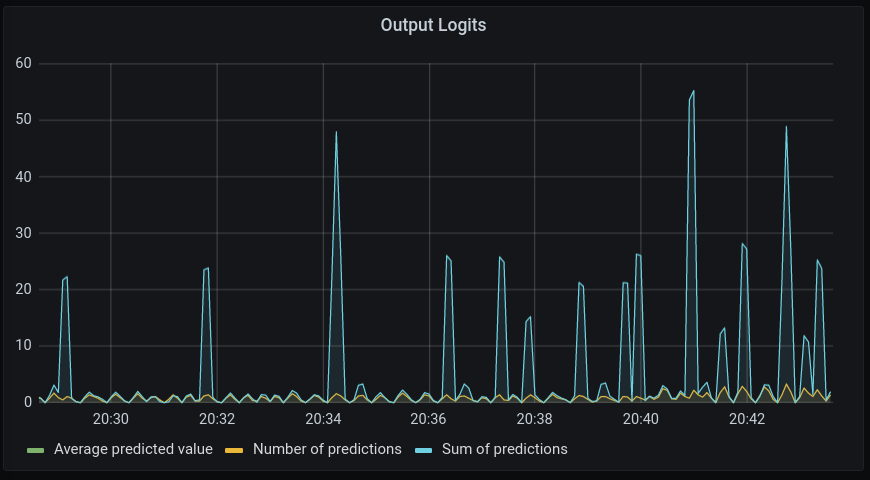
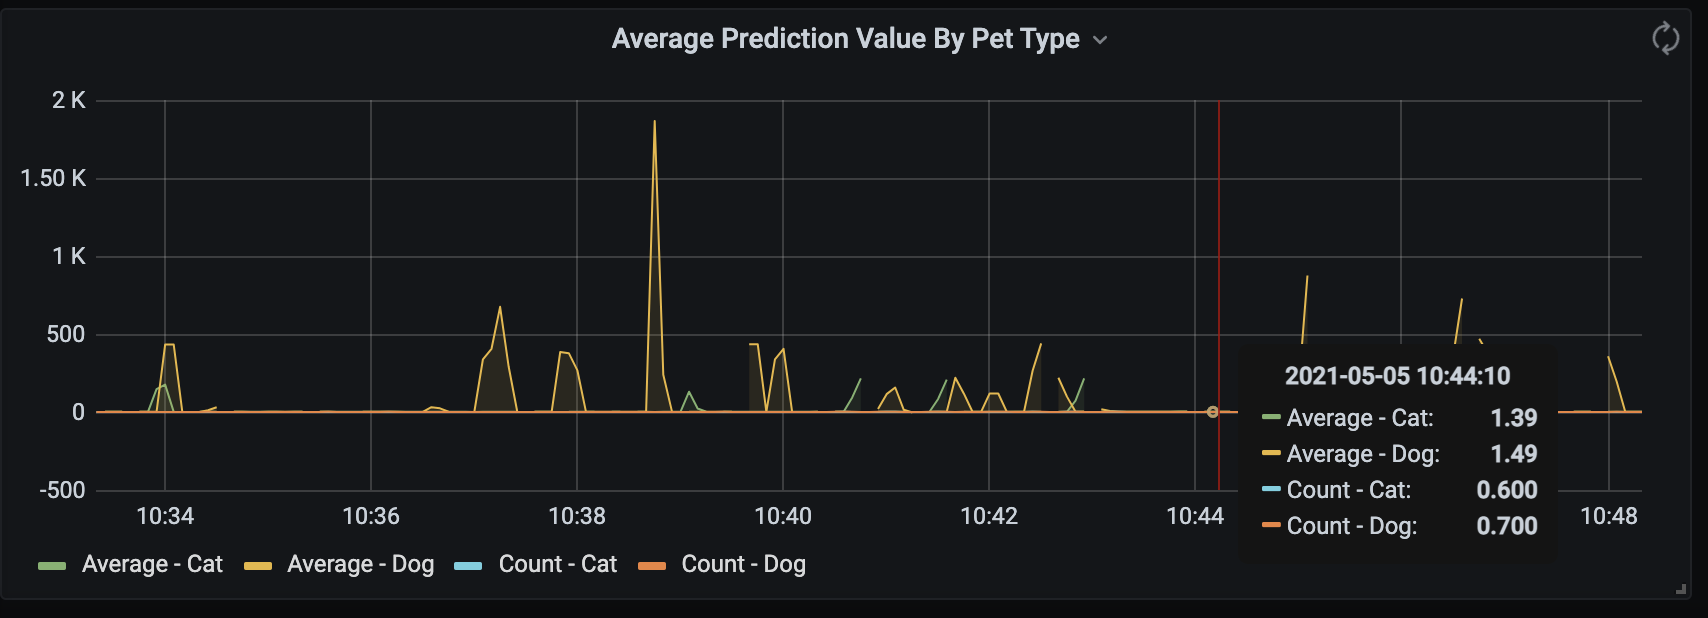
Taken with a demo Grafana instance of this agent running with a toy PetFinder model with simulated traffic.
The model is built using this Tensorflow tutorial
Images of the agent are maintained on Docker Hub.
The agent takes as input a configuration to define what metrics to create based on input and output JSONs. Based on this, the agent provides a HTTP endpoint (by default /metrics) with metric aggregates.
The expected usage is to use Prometheus to periodically scrape these endpoints. This can be then used as a data source for a Grafana dashboard for visualizations and alerts.
End-to-end examples with Kubernetes and Docker Compose are provided in the example/ subdirectory.
The configuration allows specifying metrics based on the JSON input features and the output predictions.
Additionally, input features can be parsed to create labels that are tagged to input and output metric instances.
The config format is defined at api/proto/metricrule_metric_configuration.proto.
See an example configuration used for the demo at configs/example_sidecar_config.textproto.
The configuration is supplied as a config file, with location defined by the SIDECAR_CONFIG_PATH environment variable.
Configuration is through environment variables. Some options of interest are:
- Set
REVERSE_PROXY_PORTto the port the agent is running on, e.g"9551" - Set
APPLICATION_HOSTto the host the serving endpoint is running on, defaults to"127.0.0.1" - Set
APPLICATION_PORTto the port the serving endpoint is running on, e.g"8501" - Set
METRICS_PATHto the path where a HTTP endpoint for metrics scraping should be exposed at, defaults to"/metrics"
We ❤️ contributions. Please see CONTRIBUTING.md.
Please feel free to use the Issue Tracker and GitHub Discussions to reach out to the maintainers.
Please refer to metricrule.com for more information.