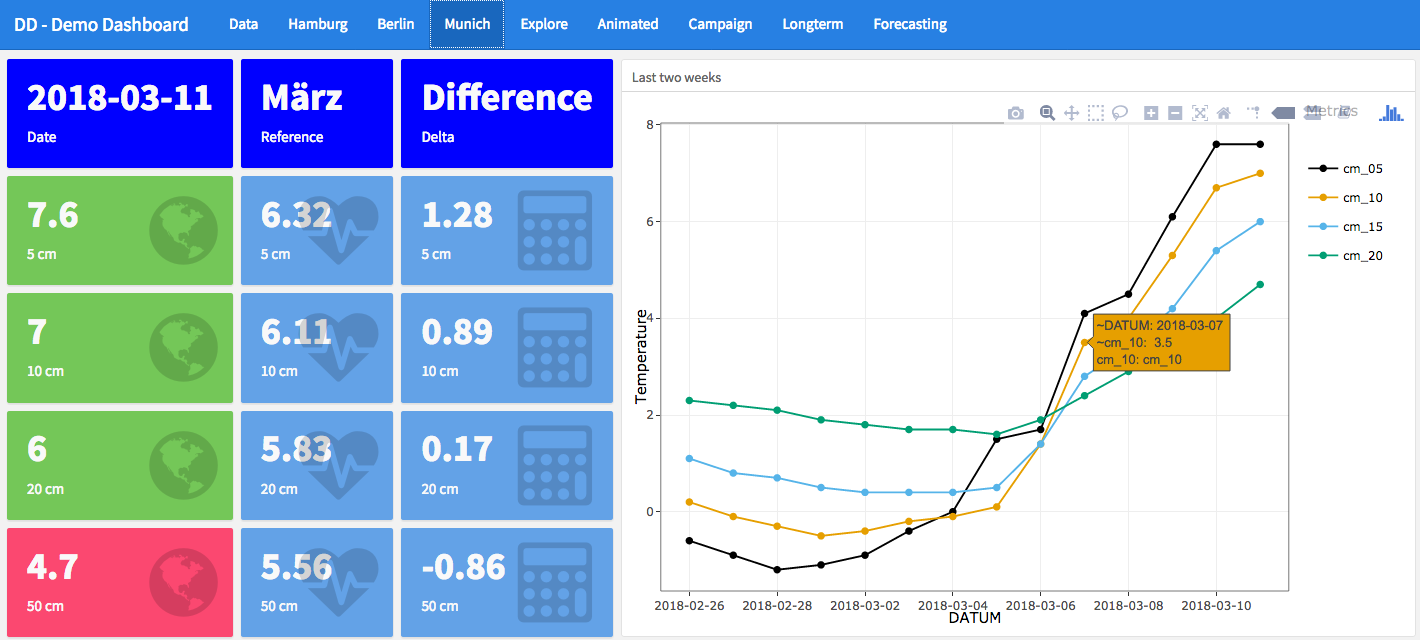
This is an interactive Demo Dashboard in R using flexdashboard, shiny, plotly and ggplot.
The Dashboard comes as a set of .Rmd or RMarkdown files plus some standard R scripts. In order to run it you need to have downloaded certain packages and most probably it is a good idea to have RStudio and R version 3.4.x installed
- markdown
- knitr
- flexdashboard
- ggplot2
- plotly
- shiny
- CausalImpact
- prophet
Some of these packages will have additional requirements, i.e. install additional packages.
After installing the packages and once you have downloaded the source files from this repository (or cloned/forked the repository, whatever you prefer, but don't forget the Data folders), open the file "Demo_Dashboard.Rmd" with RStudio and click on "Run Document".
In case this does not work out of the box, try changing the working directory to the file's directory first: Session -> Set Working Directory -> To Source File Location
The raw data was downloaded on 2018-05-16 from the Climate Data Center (CDC, provided by Deutscher Wetterdienst (DWD)) https://www.dwd.de/EN/ourservices/cdcftp/cdcftp.html
Visit me on LinkedIn or XING
https://de.linkedin.com/in/stefan-k%C3%BChn-020a34119
https://www.xing.com/profile/Stefan_Kuehn46