![]()
Given a universe of
In a backtest we iterate in time (e.g. row by row) through the matrix and allocate positions to all or some of the assets. This tool shall help to simplify the accounting. It keeps track of the available cash, the profits achieved, etc.
It is possible to install cvxsimulator with the quantstats extra
pip install cvxsimulator[quantstats]or without it
pip install cvxsimulatorThe simulator shall be completely agnostic as to the trading policy/strategy. Our approach follows a rather common pattern:
We demonstrate those steps with somewhat silly policies. They are never good strategies, but are always valid ones.
The user defines a builder object by loading prices and initialize the amount of cash used in an experiment:
import pandas as pd
from cvx.simulator import Builder

prices = pd.read_csv("prices.csv", index_col=0, parse_dates=True, header=0)
b = Builder(prices=prices, initial_aum=1e6)
Prices have to be valid, there may be NaNs only at the beginning and the end of each column in frame. There can be no NaNs hiding in the middle of any time series.
It is also possible to specify a model for trading costs. The builder helps to fill up the frame of positions. Only once done we construct the actual portfolio.
We have overloaded the __iter__ and __setitem__ methods to create a custom loop.
Let's start with a first strategy. Each day we choose two names from the
universe at random.
Buy one (say 0.1 of your portfolio wealth) and short one the same amount.
for t, state in b:
    # pick two assets at random
    pair = np.random.choice(state.assets, 2, replace=False)
    # compute the pair
    units = pd.Series(index=state.assets, data=0.0)
    units[pair] = [state.nav, -state.nav] / state.prices[pair].values
    # update the position
    b.position = 0.1 * units
    # Do not apply trading costs
    b.aum = state.aum
Here t is the growing list of timestamps, e.g. in the first iteration
t is
A lot of magic is hidden in the state variable. The state gives access to the currently available cash, the current prices and the current valuation of all holdings.
Here's a slightly more realistic loop. Given a set of
for t, state in b:
    # each day we invest a quarter of the capital in the assets
    b.position = 0.25 * state.nav / state.prices
    b.aum = state.aum
Note that we update the position at the last element in the t list using a series of actual units rather than weights or cashpositions. The builder class also exposes setters for such alternative conventions.
for t, state in b:
    # each day we invest a quarter of the capital in the assets
    b.weights = np.ones(4)*0.25
b.aum = state.aumOnce finished it is possible to build the portfolio object
portfolio = b.build()The portfolio object supports further analysis and exposes a number of properties, e.g.
portfolio.nav
portfolio.cash
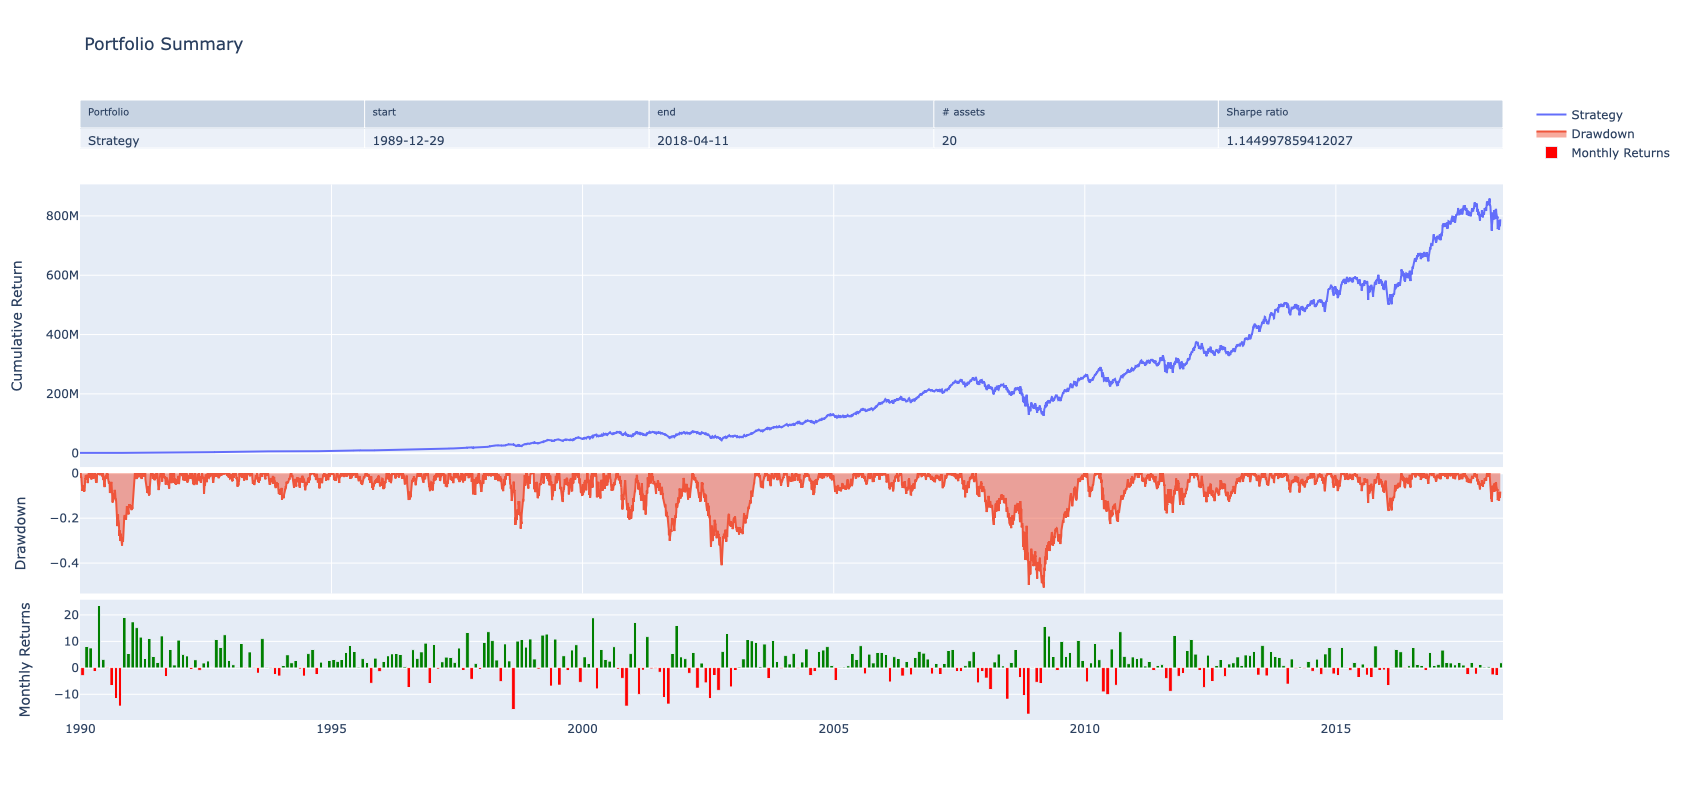
portfolio.equityIt is possible to perform
portfolio.snapshot()We have also integrated the quantstats
package as an optional extra for further analysis. It is usually enough to inject
the portfolio.nav into the many functions exposed by this package.
We assume you share already the love for Poetry. Once you have installed poetry you can perform
make installto replicate the virtual environment we have defined in pyproject.toml.
We install JupyterLab on the fly within the aforementioned virtual environment. Executing
make jupyterwill install and start the jupyter lab.