US government investments more than $400 billion each year that comprises of $4 trillion in 10 years. So, there is need to have better estimation of population to do better planning for Hospitals, Roads, Business leaders to make better strategies. In this work we proposed an approach in which variables from American Community Survey are used also included in Census 2010 questionnaire, we called as Artificial Data. Arima and Exponential techniques are applied for forecasting.
At Census Bauru website, the data about Population & Housing is giving in pdf format from 1790-2010 that requires OCR to extract data, we can extract the desired data over the time till 1920 NHGIS Data Finder. But over the time period new variables are introduced in the census, so, it would be difficult to make data points on time series over multiple years i.e. we can backtrack only two variables “Total Population & Person by Sex” from 1920 to 2010. So, question arises how to arrange the data that can at least include all variable from the latest two census held in 2000 & 2010.
The Naïve Answer came in mind from the Census 2010 History Overview, which announced the shortest census of history only considering 10 question in questionnaire related to name, gender, race etc. and rest of data collection from the ACS; “ARTIFICIAL DATA”. So, we can make data points over the years from the various surveys e.g. ACS, Economic Census, Business Dynamic Statistics etc. It would be clearer by considering the following figure.
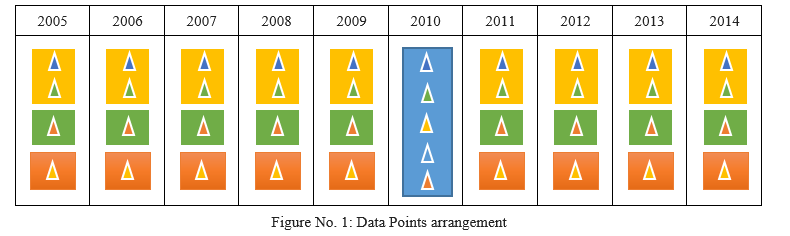
Where Rectangle show the Census, ACS, Economic Census, Business Dynamic Statistics; Blue as Census, Yellow as ACS, Green as Economic Census and Orange as Business Dynamic Statistics. And triangle represents the variables under focus
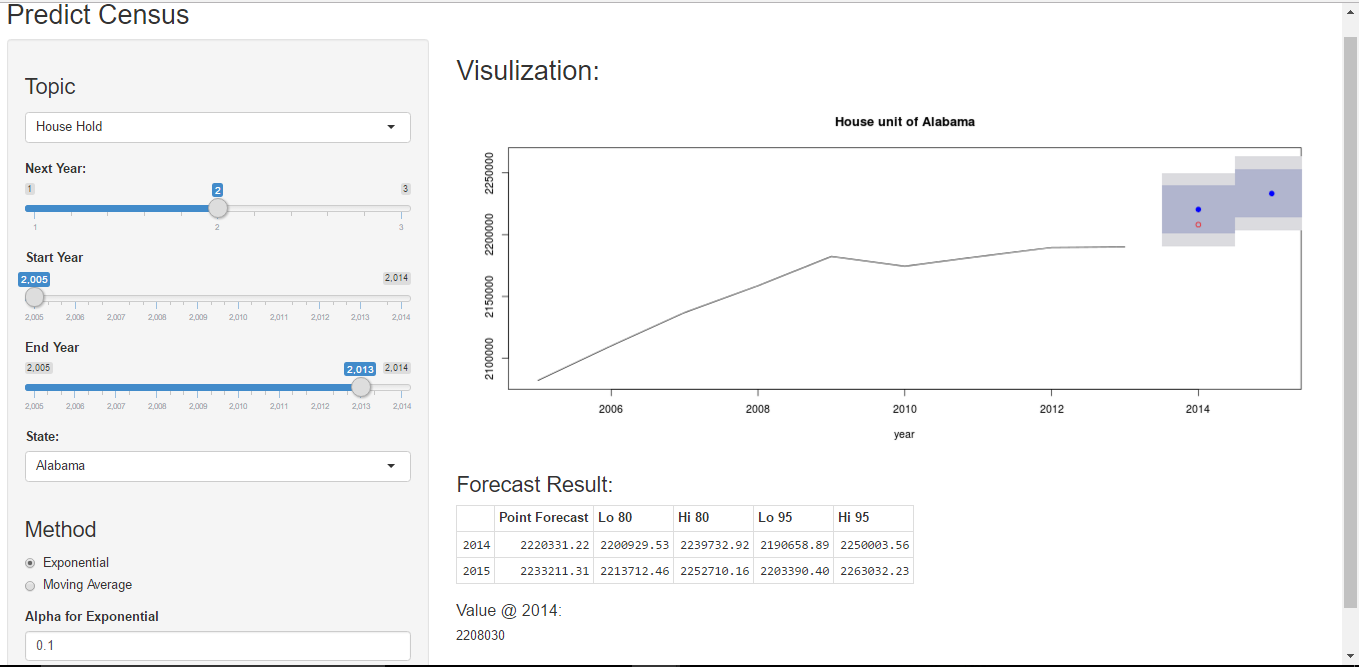
Generating Data points from 2005 to 2014, we have created a dashboard on R-Shinny that forecast the Census Question at state level. The Dash board can be seen below:
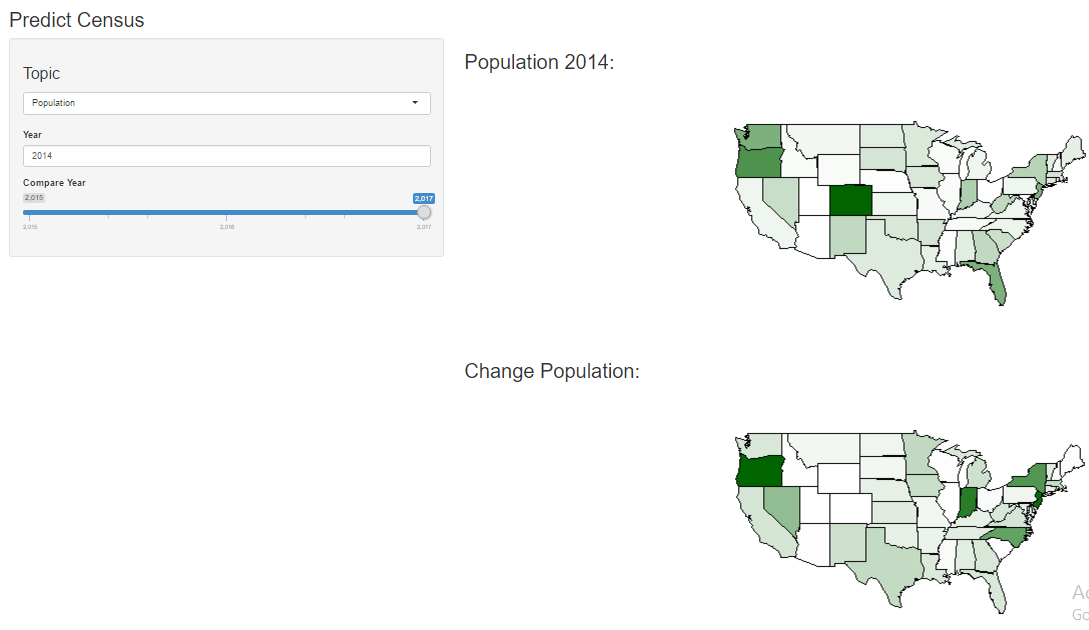
The Difference in forecasted population is also drawn on map to get better estimation.
The real time application is live on https://hamzafar.shinyapps.io/houseHold/