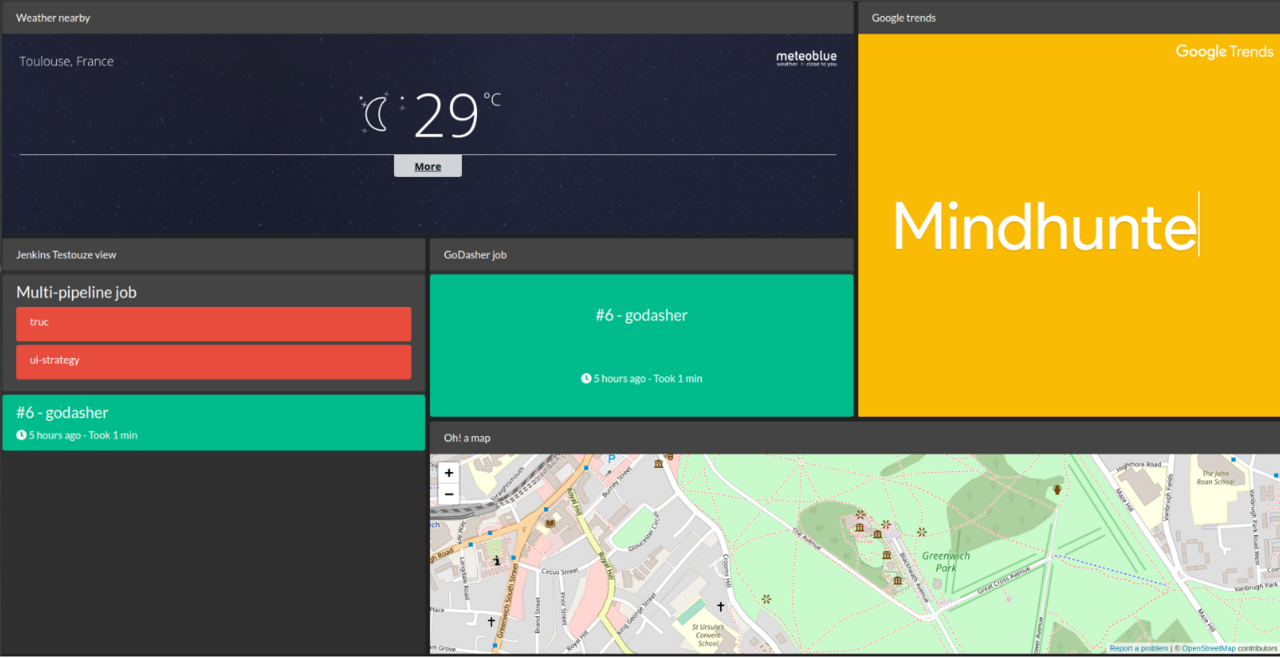
- Build dashboards screen using only configuration file
- Automatic grid layout
- Native browser grid system
- It's all plugin, so it's easy to extend
- No web framework constraint
- Fast and light
- Runs well on a docker environment
See how it works: https://github.com/jochy/godasher/wiki/Create-a-dashboard
It's very simple. First, create a configuration file, let's say config.yml
port: 8000
rotationtime: 15 # Rotate dashboard every 15 secondes
theme: dark

dashboards:
  - title: 'My dashboard'

    components:
      - type: iframe
        title: 'Weather nearby Toulouse - France'
        width: 2
        height: 1
        column: 0
        row: 0
        data:
          url: 'https://www.meteoblue.com/en/weather/widget/three/toulouse_france_2972315?geoloc=fixed&nocurrent=0&noforecast=0&noforecast=1&days=4&tempunit=CELSIUS&windunit=KILOMETER_PER_HOUR&layout=image&location_url=https%3A%2F%2Fwww.meteoblue.com%2Fen%2Fweather%2Fwidget%2Fthree%2Ftoulouse_france_2972315&location_mainUrl=https%3A%2F%2Fwww.meteoblue.com%2Fen%2Fweather%2Fforecast%2Fthree%2Ftoulouse_france_2972315&nolocation_url=https%3A%2F%2Fwww.meteoblue.com%2Fen%2Fweather%2Fwidget%2Fthree&nolocation_mainUrl=https%3A%2F%2Fwww.meteoblue.com%2Fen%2Fweather%2Fforecast%2Fthree&dailywidth=115&tracking=%3Futm_source%3Dweather_widget%26utm_medium%3Dlinkus%26utm_content%3Dthree%26utm_campaign%3DWeather%252BWidget'

      - type: iframe
        title: 'Google trends'
        width: 1
        height: 2
        column: 2
        row: 0
        data:
          url: "//hawttrends.appspot.com/?delay=9000&neat=1&p=1"

      - type: iframe
        title: 'Oh! a map'
        width: 2
        height: 1
        column: 1
        row: 2
        data:
          url: 'https://www.openstreetmap.org/export/embed.html?bbox=-0.004017949104309083%2C51.47612752641776%2C0.00030577182769775396%2C51.478569861898606&layer=mapnik'

      - type: iframe
        title: 'Live attack map'
        width: 1
        height: 2
        column: 0
        row: 1
        data:
          url: 'https://threatmap.checkpoint.com/ThreatPortal/livemap.html'

      - type: iframe
        title: 'Bitcoin market'
        width: 1
        height: 1
        column: 1
        row: 1
        data:
          src: '<script src="https://widgets.coingecko.com/coingecko-coin-ticker-widget.js"></script><coingecko-coin-ticker-widget currency="usd" coin-id="bitcoin" locale="en" background-color="#a9a6a6"></coingecko-coin-ticker-widget>'

  - title: 'My second dashboard'
    components:
      - type: iframe
        title: 'A beautiful graph from Grafana'
        width: 1
        height: 1
        column: 0
        row: 0
        data:
          url: 'https://snapshot.raintank.io/dashboard-solo/snapshot/y7zwi2bZ7FcoTlB93WN7yWO4aMiz3pZb?from=1493369923321&to=1493377123321&panelId=4&orgId=2'
Next, start your docker container
docker run --name=godasher -v $PWD/config.yml:/app/config.yml -p 8000:8000 godasher:lastest
Finally, open your browser and navigate to http://localhost:8000
All the rendering stuff is handled only by plugins, which are located in /app/plugins.
You can create your own rendering plugin. You can use the template (src/plugins/template) to initiate your plugin.
There is no framework constraints ; you can use plain HTML/CSS or you can also include some React and Vue components.
You change the theme of the dashboard. For now, you have 2 themes:
- dark (default)
- light