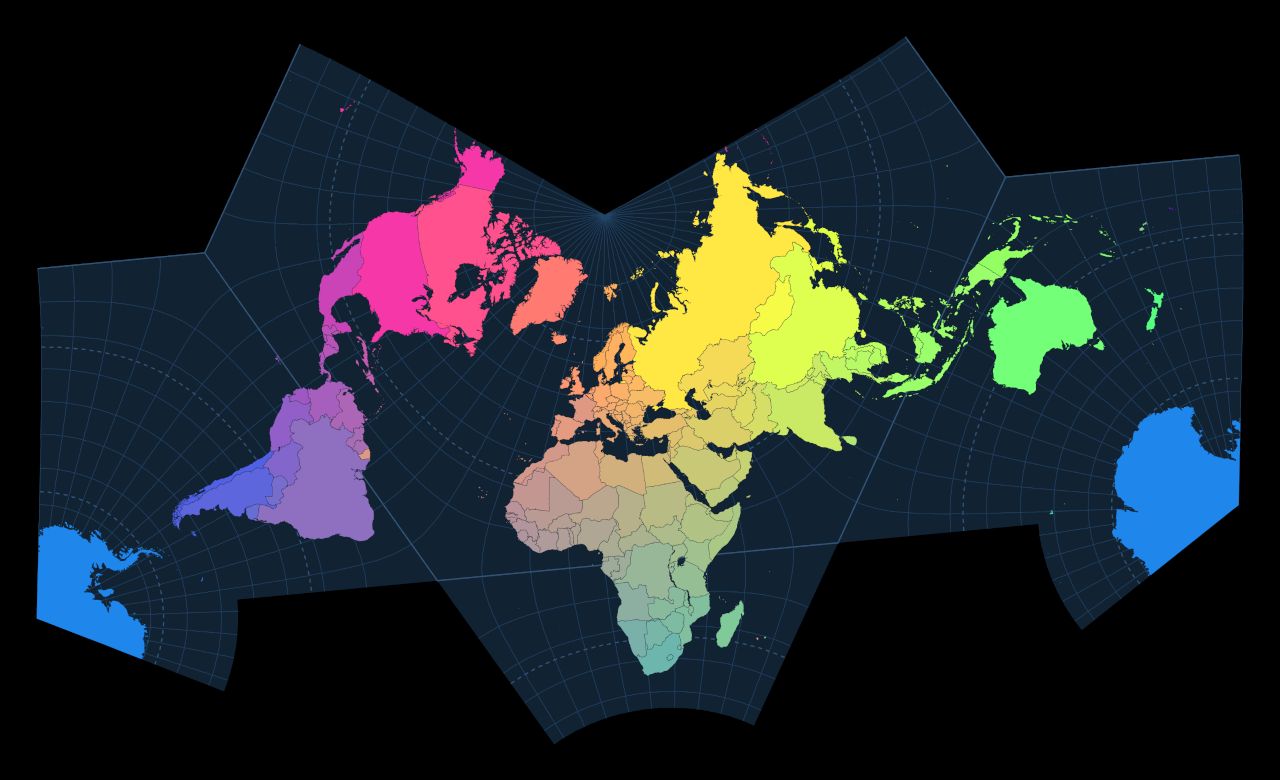
This small web app is a JavaScript implementation of the Cahill–Concialdi Bat map projection and which generates the map as an embedded SVG image (for vector layers) or an HTML Canvas image (for raster layers).
The Cahill–Concialdi Bat map projection was created by Luca Concialdi in 2015 and is essentially a rearrangement of the conformal variant of the butterfly map projection developed by Bernard J. S. Cahill in 1909. The rearrangement aimed to ensure that the northern hemisphere is uninterrupted with the only cut located at the Bering Strait, and puts New Zealand right next to Australia, which is not the case in almost all variants and adaptations of Cahill’s map projections, such as the Cahill–Keyes. If you want more background information about this new map projection, then read this blog post.
I came across this map projection in early 2020 and it instantly became my most favorite because it meets almost all of the qualities that I am looking for in a worldwide map projection: the map is conformal, mostly uninterrupted for landmasses (except for Antarctica), and is roughly equal-area for the landmasses (again except for Antarctica). While I really like the Cahill and Waterman families of octohedral map projections and Buckminster Fuller’s icosahedral Dymaxion map, the beauty of the Cahill–Concialdi is that it looks simpler (especially compared to the Dymaxion map) and has less “cuts” (compared to Cahill–Keyes). I also appreciate the decision not to separate New Zealand from Australia and not dividing or otherwise wrenching Iceland away from either Greenland or northern Europe. The only major problem is that Antarctica is mangled and way too big. But I personally think this is an acceptable compromise because Antarctica is almost uninhabited and I consider fidelity to the other major landmasses to be worth more.
Forward projection refers to the process of transforming spherical Earth coordinates (latitute and longitude) to Cartesian map coordinates (x and y). This is the basic math needed in any software-based map projection and is primarily used to render vector map layers.
For my implementation, the JavaScript source code for the core forward projection was ported from the Java implementation of the conformal Cahill projection developed by Justin Kunimune for his Map Projections software. I am actually very thankful to Justin for providing an open-source implementation of the map projection because I have no access to the conformal math developed by L.P. Lee in 1976 and the math itself is way over my head. Specifically, I ported and adapted the following Java methods, which maps spherical coordinates in a single Earth octant to one of the map's octahedral faces:
| Justin’s Java method | Java source file | My JavaScript function | JavaScript source file |
|---|---|---|---|
faceProject() |
src/maps/Octohedral.java | projectInOctant() |
cahill-conformal.mjs |
polynomial() |
src/maps/Octohedral.java | projectConformal() |
cahill-conformal.mjs |
obliquifySphc() |
src/maps/Projection.java | Pole.mapObliqueLatLon() |
spherical.mjs |
I also load the Complex.js JavaScript library, to implement the complex math in Justin’s code.
As for the rest of the projection code, that is, the process of dividing the Earth into areas and recombining the projected octahedral map faces into the resulting map, I reimplemented it by myself and it was very easy to do so once you understood how spherical coordinates are projected onto each octahedral face.
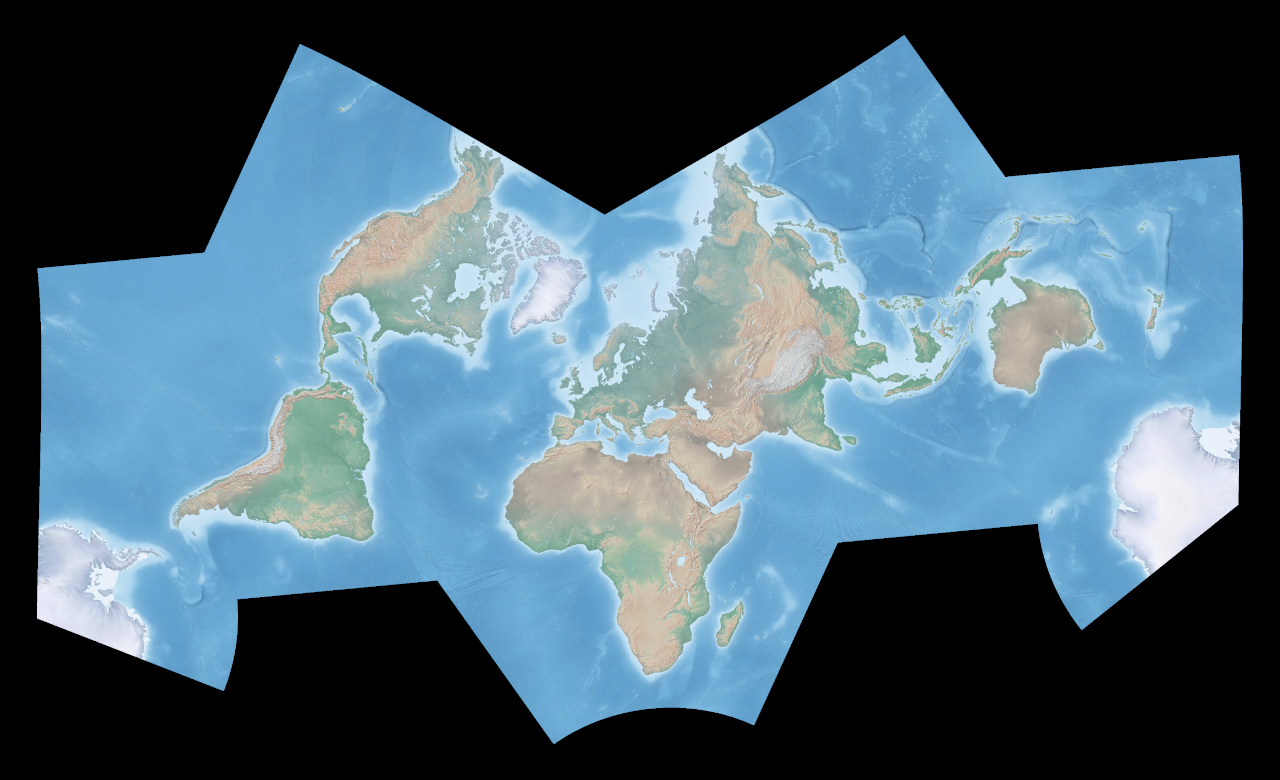
Inverse projection refers to the process of reversing a forward projection. That is, converting back from Cartesian map coordinates to spherical Earth coordinates. This process is often needed to render raster map layers.
Similar to the forward projection, I could have simply ported Justin’s Java code which has methods for the inverse projection, but because of the customizations that I implemented in my forward projection code, porting would not be as easy.
Instead, I decided to implement an approximate and faux inverse projection. I divided the map into 1°×1° cells and treated each cell as a simple linear quadrilateral. I then solved the system of quadratic equations needed to convert any Cartesian point in any map cell to its relative position in the corresponding spherical cell. This worked quite well because the faux linear cells are visually indistinguishable from the true curved projected cells unless you were way too zoomed in.
One significant change that I did from Luca’s original arrangement is that I used 168.5°W as my dividing line on the Bering Strait instead of Luca’s original 170°W which clips the tip of the Chukchi Peninsula on the easternmost part of Russia and the large St. Lawrence Island in Alaska. Unfortunately, there is no line of longitude passing through the Bering Strait that doesn’t cut any island, but using 168.5°W at least only cuts the minor Aleutian island of Umnak.
To depict the landmasses, countries, and boundaries, I simply grabbed the GeoJSON data from Natural Earth, and simplified it by:
- rounding coordinates to 2 decimal places,
- stripping out the excess properties,
- coercing all country polygons into GeoJSON
MultiPolygon(4D) arrays, and - collapsing the GeoJSON structure to the minimum JSON structure that I needed.
In addition, I manually divided Antarctica along the 150°W meridian and the aforementioned island of Umnak along the 168.5°W meridian to match the cuts of the map projection.
For the raster map layers, I included the following four map imagery from Natural Earth and NASA: